
New Interface in Version 3.7
DataPartner is excited to announce new functions with the version 3.7 in Invest for Excel, which are the following:
- Appearance
- Microsoft Excel versions supported
- Digitally signed program code
- Elimination of internal transactions
- Roll forecast
- Currency file
- Consolidation with currency translation
- Consolidation of financing files
- Income Statement
- Working Capital
- Miscellaneous
- Clear input cells of hidden rows
- Picture copy
- Unfreeze/freeze column headers (Calculation sheet)
- Variable analyses
- Change indicators
- Annual change % in cell
- Flip buttons for sub-rows
- Formatting cells
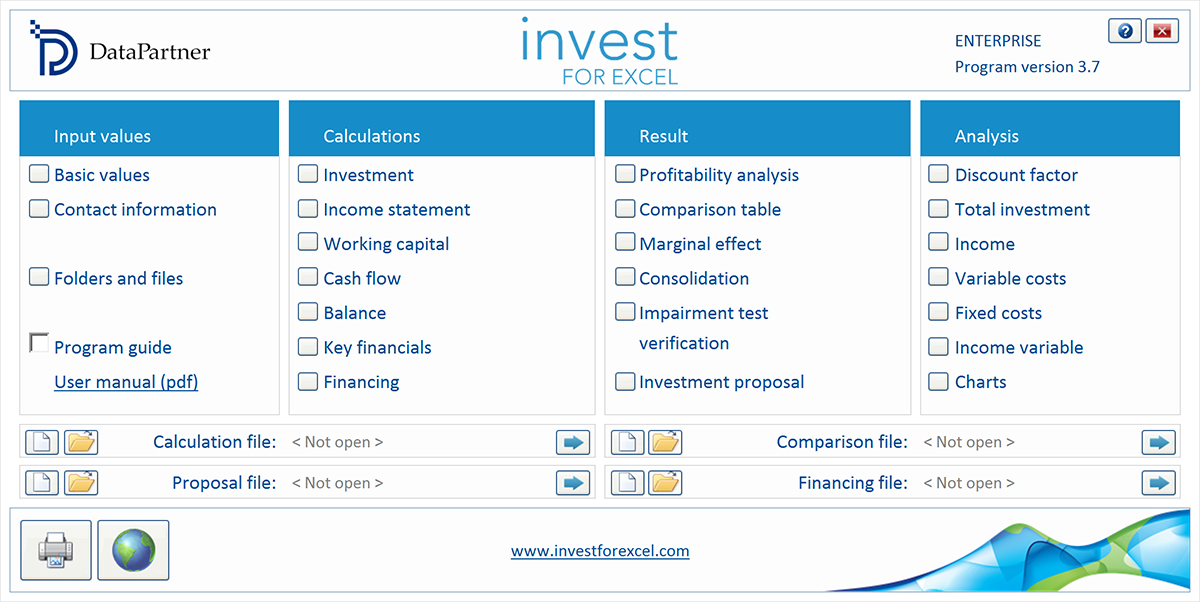
Invest for Excel 3.7 has an updated appearance with lighter colors and updated buttons.
Invest for Excel buttons (input example)
Microsoft Excel versions supported
Invest for Excel 3.7 is supported for Microsoft Excel versions 2007, 2010 and 2013 for Windows XP, Windows Vista, Windows 7, Windows 8, Windows 8.1 and Windows 10.
Invest for Excel program code is currently signed with a digital signature which is valid until August 9, 2016.
Elimination of internal transactions
Elimination is available in Enterprise edition for consolidation of calculation files. The elimination function removes the effects of inter-company transactions in a consolidation statement.
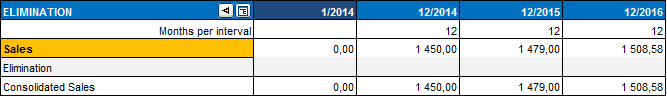
When consolidating calculation files, it is possible to apply eliminations of internal transactions. Eliminations can be specified on a separate sheet, which can be included in the Invest for Excel Options (Other options tab).

An empty Eliminations sheet is included in the calculation file.
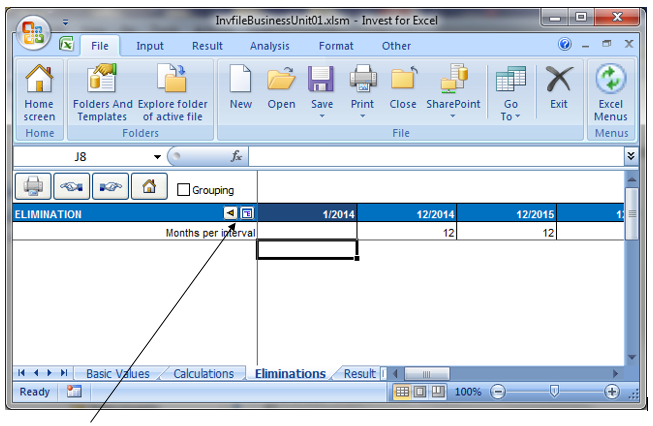
Press the ![]() button to select the calculation row, which corresponds to the elimination you want to add. A select screen for choosing Calculation rows is shown:
button to select the calculation row, which corresponds to the elimination you want to add. A select screen for choosing Calculation rows is shown:
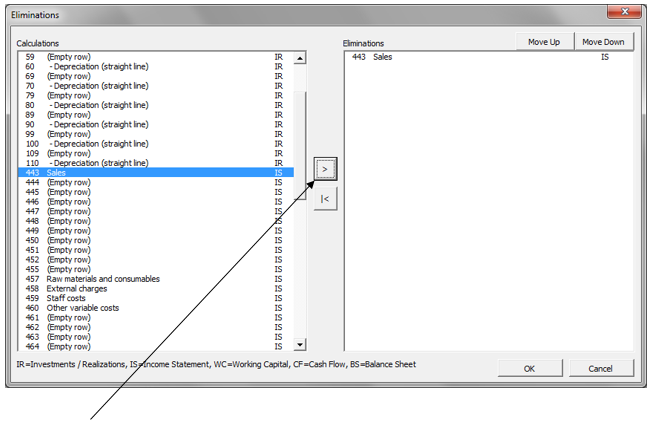
Press the ![]() button to include one or more rows and press OK when you are done. Selected rows will be added to the sheet for entering eliminations. You can include the same row as many times as you like.
button to include one or more rows and press OK when you are done. Selected rows will be added to the sheet for entering eliminations. You can include the same row as many times as you like.
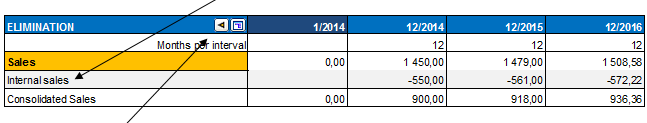
You can change the elimination row description if you like and then enter the eliminations.
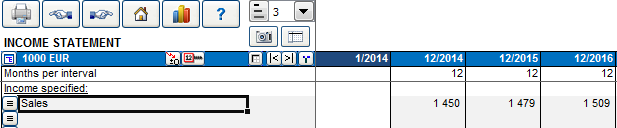
By pressing the ![]() button you can move to the corresponding row on the Calculations sheet.
button you can move to the corresponding row on the Calculations sheet.
You can use grouping of eliminations as a means to apply only part of entered eliminations when consolidating by checking Grouping.
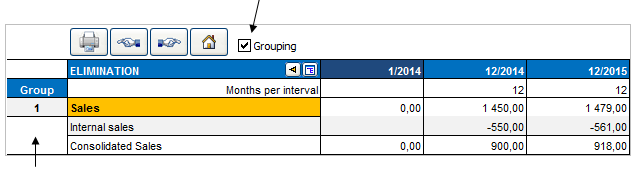
A Group column appears to left. You choose from to 25 groups of eliminations.
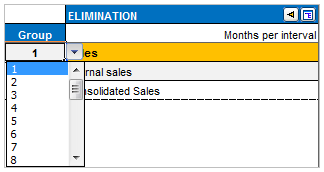
Grouping is useful when you are consolidating different parts or levels of an organisation. For example, you could apply group 1 eliminations when consolidating from lowest level units to the next level unit and all groups when consolidating to the highest level unit.
Note that you can include same rows several times and use different elimination groups. This way the elimination of one calculation number can be different for different consolidations.
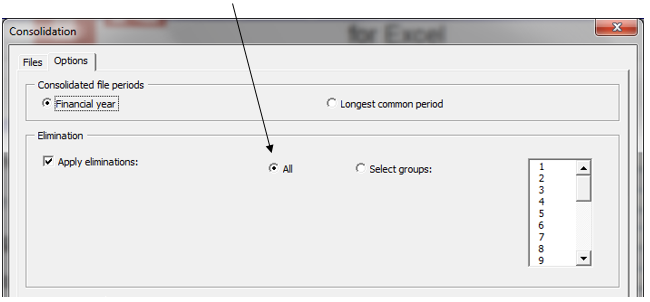
Eliminations options in consolidation are found in the Options tab of the Consolidation dialog box. By default all eliminations are applied.
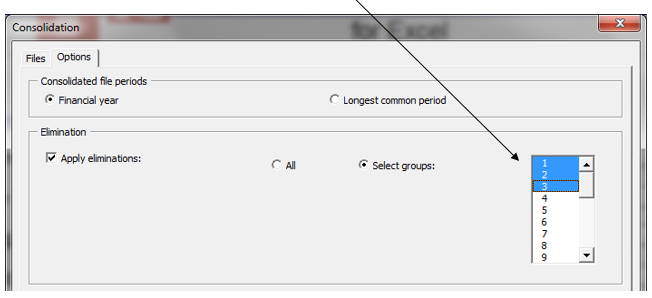
You can choose to apply only selected groups of eliminations when you are doing a partial consolidation.
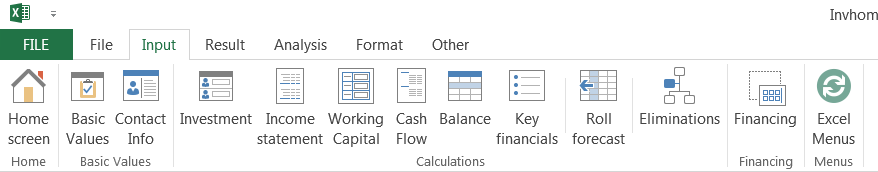
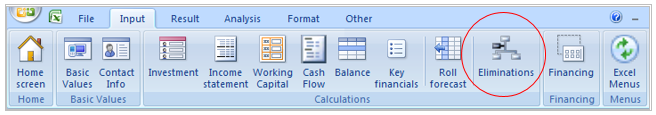
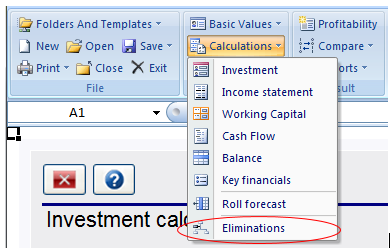
In the Invest for Excel menus, Eliminations can be found in the Input page:
In the short menu:
This feature is available in the Pro edition and Enterprise edition of Invest for Excel.
You can use this feature when you want to have a rolling forecast, i.e. a time-frame that stays the same but moves forward in time when new actual figures are available. Before rolling:
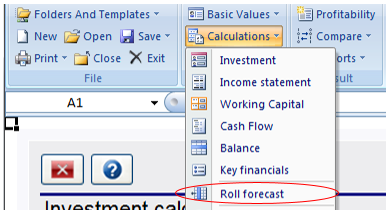
In the Invest for Excel menus, Roll forecast can be found in the Input page:
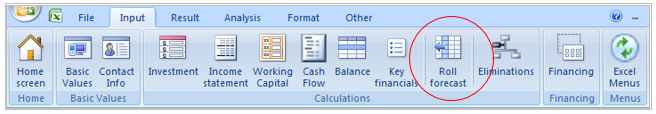
In the short menu:
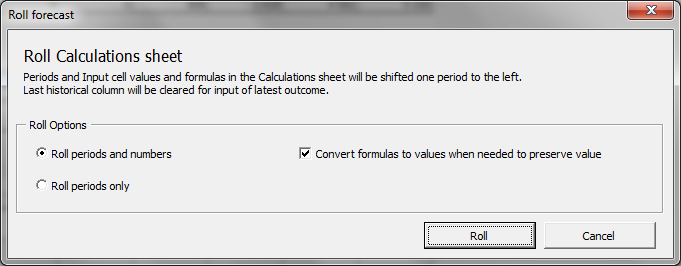
You can choose to roll periods and numbers or periods only. When you roll numbers, formulas are converted to values if the moved formula would change the value of the cell. If you however prefer to keep all formulas even if values would change, you can uncheck the “Convert formulas to values when needed to preserve value” checkbox.
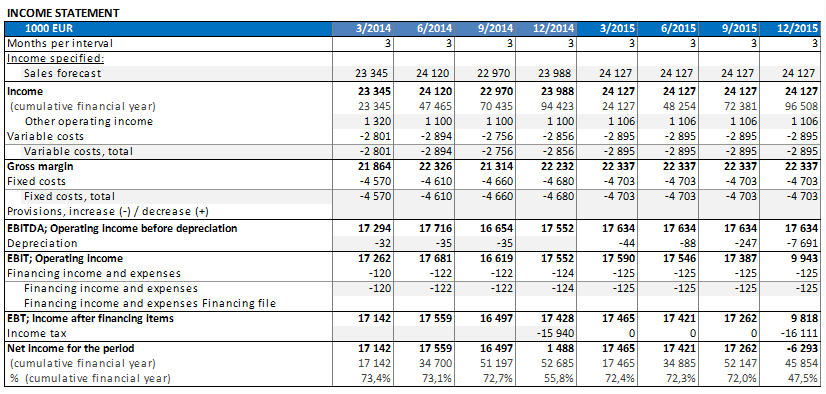
After rolling (periods and numbers):
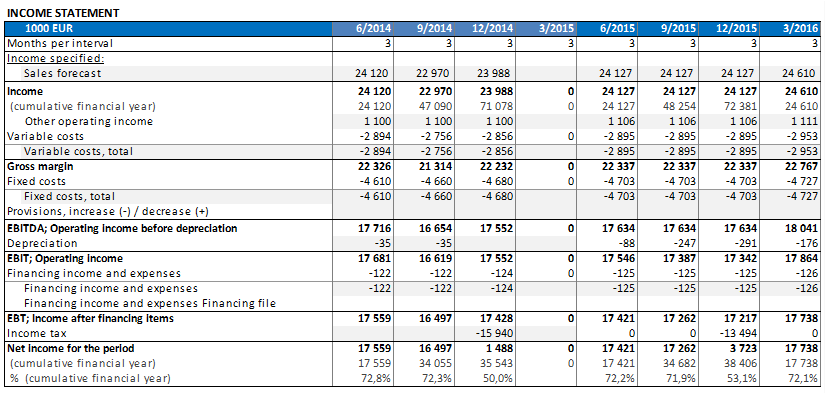
You can see that actual values (2014) have moved left and quarter 3/2015 is cleared for actual numbers entry.
When rolling periods only, all numbers stay in their cells and only the periods are moved one column to the left.
Currency translation is available in Enterprise edition for consolidation of calculation files and financing files. A currency file can be used to handle currency translation rates.
To create a new Currency file, choose “New” in the Invest File menu. Choose “New Currency File” in the opening dialog box:
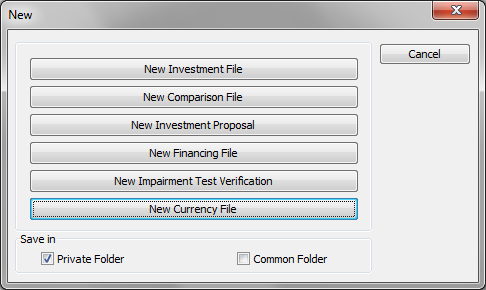
A new currency file will open:
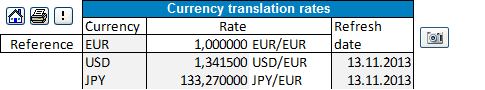
You can enter the currency translation rates manually or update the rates from the European Central Bank web service by clicking the ![]() button. Note that all rates that are found in the European Central Bank web service will automatically be updated. (Note that, for this to work, you need to be connected to internet and Microsoft Excel must be allowed to run internet queries.)
button. Note that all rates that are found in the European Central Bank web service will automatically be updated. (Note that, for this to work, you need to be connected to internet and Microsoft Excel must be allowed to run internet queries.)
A new currency file can also be created from the Consolidation dialog boxes.
Consolidation with currency translation
To consolidate with currency translation, check Translate currency in the Options tab of the Consolidation dialog box.
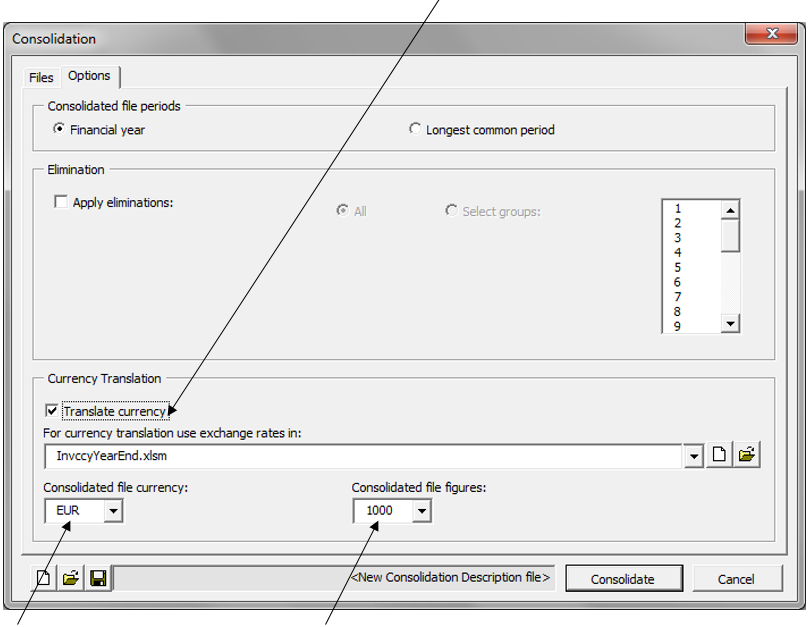
Specify the currency file to use when translating currencies and specify consolidated file currency and the unit in which to show figures.
Note that each consolidated source files must have currency specified in the basic values.
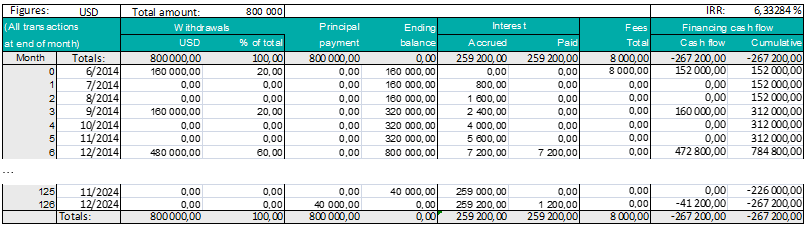
Consolidation of financing files
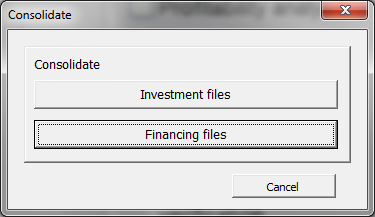
To consolidate financing files, press “Financing files” in the “Consolidate” dialog box:
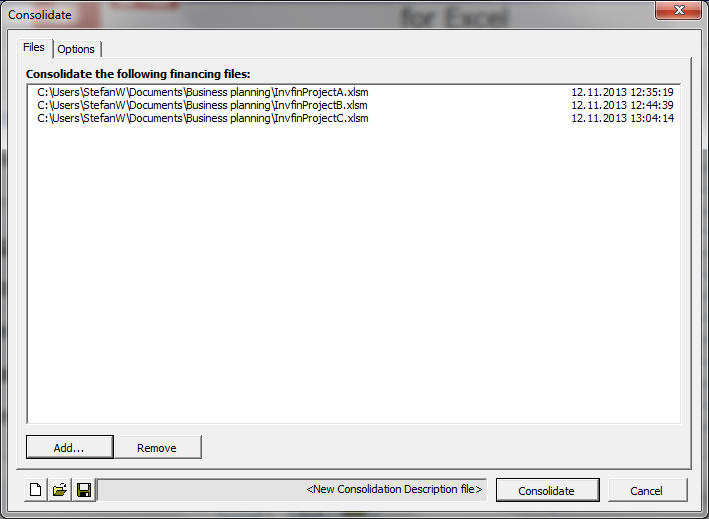
Press “Add…” in the “Consolidate” dialog box to add the files you want to consolidate:
In the Options page you can choose Currency translation. Check “Translate currency”:
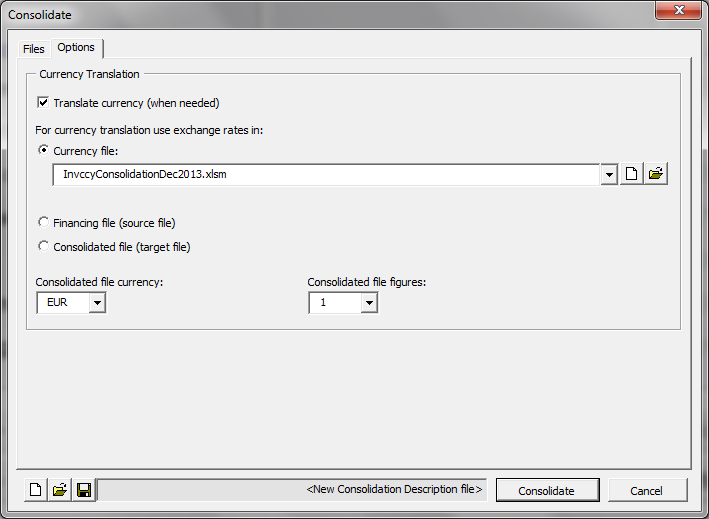
For currency translation you can use exchange rates in:
- Currency file. When new Currency file is chosen, a new currency file is created and the rates are automatically refreshed from the European Central Bank web service. (Note that, for this to work, you need to be connected to internet and Microsoft Excel must be allowed to run internet queries.)
- Financing file (source file). The rates in the first financing file are used.
- Consolidated file (target file). This option can be useful when the consolidated file is updated.
Used currency rates are copied to the consolidated file.
The consolidated file will include all periods found in the source files. Example:
Source file A:
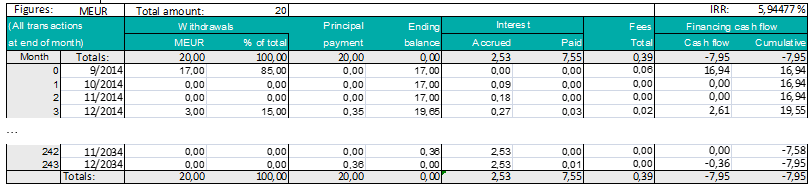
Source file B:
Source file C: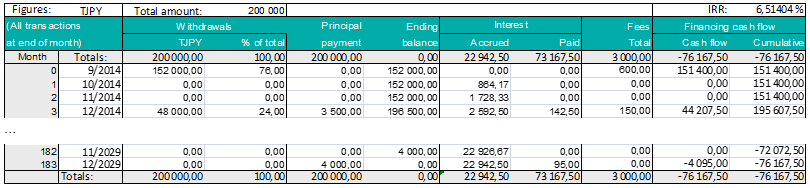
Consolidated file: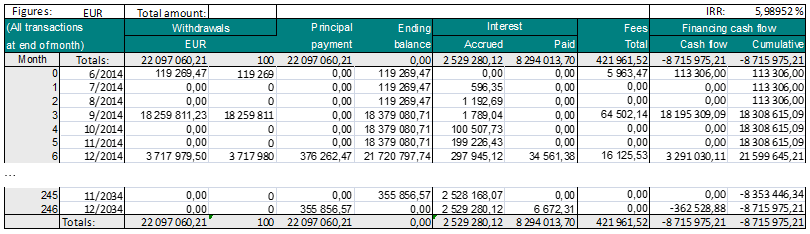
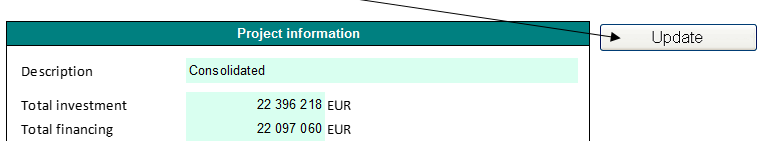
The consolidated file can easily be updated from the Project sheet.
Income Statement
There are 10 income rows, 10 variable cost rows and 10 fixed cost rows available, all with the possibility to add sub-rows.
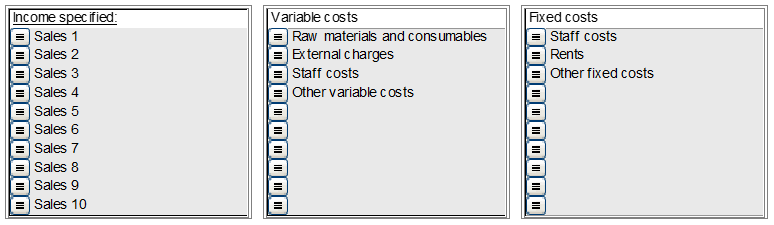
As two levels of up to 99 sub-rows are available, you can have up to 98010 rows for income, for variable costs and for fixed costs (10 * 99 * 99 = 98010).
Working Capital
Each of the main Working capital groups (Short-term assets, Inventories and Current liabilities) can be specified in up to 5 sub-groups.
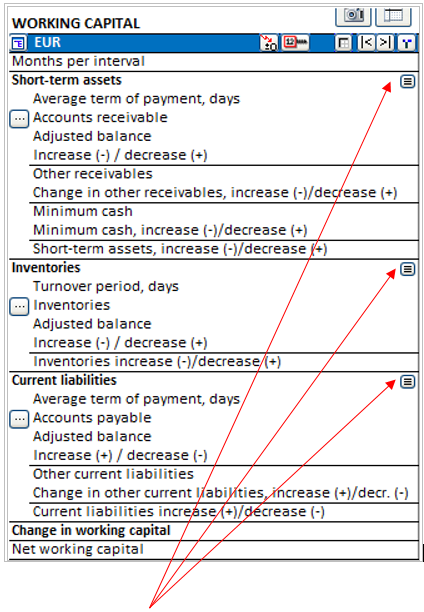
Click the small ![]() button for the asset group you want to specify in more detail. The Specify dialog box is shown for the asset group. Example Accounts receivable:
button for the asset group you want to specify in more detail. The Specify dialog box is shown for the asset group. Example Accounts receivable:
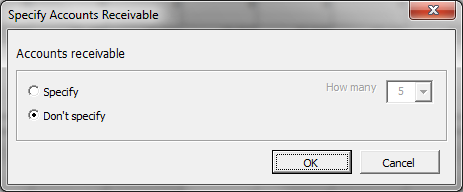
Choose Specify and choose how many subgroups (2-5) you want.
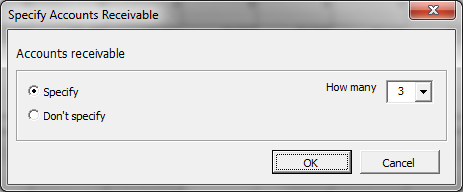
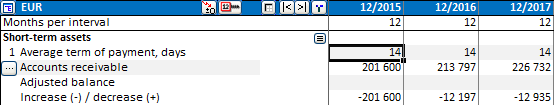
Click OK and the working capital table will give you the chosen number of subgroups.
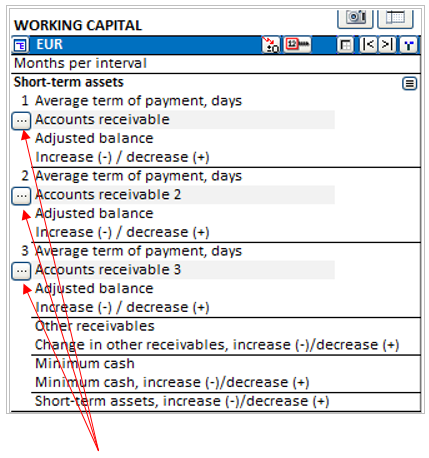
For each working capital subgroup you can define which Income Statement row(s) that the calculation is based on. Click the ![]() button for the subgroup.
button for the subgroup.
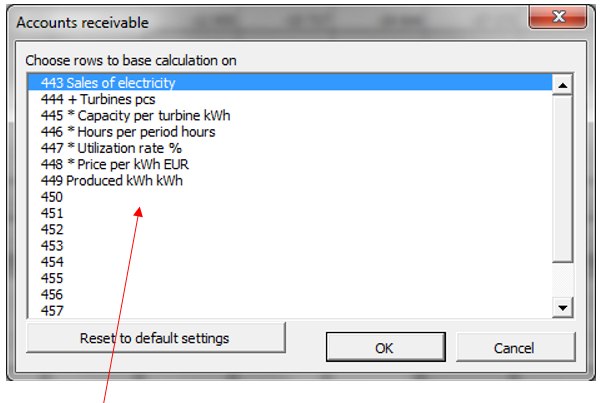
Choose row(s) to base the calculation on from the list of rows. In the table you can enter average number of days that you want to use as the term of payment.
Miscellaneous
Clear input cells of hidden rows
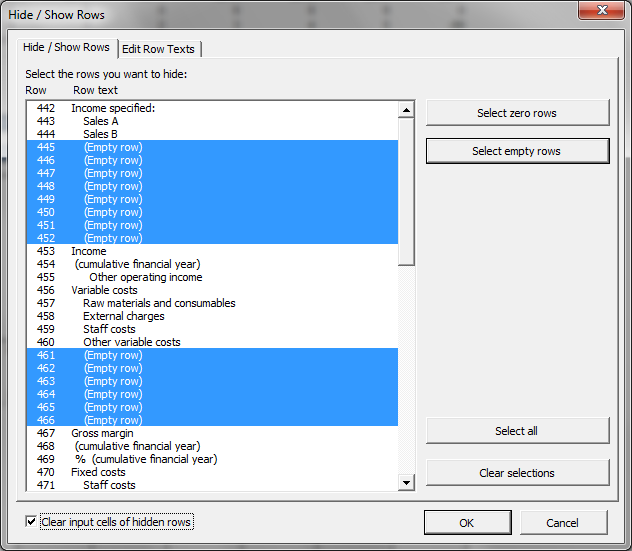
When hiding rows in a calculation file, you can choose to clear input cells on the rows to be hidden. This way you can make sure that no numbers or formulas that could impact the result of the calculation will accidently be left on the hidden rows. Text cells will not be cleared.
Check “Clear input cells of hidden rows” in the “Hide / Show Rows” dialog box to use this function when you are hiding rows.
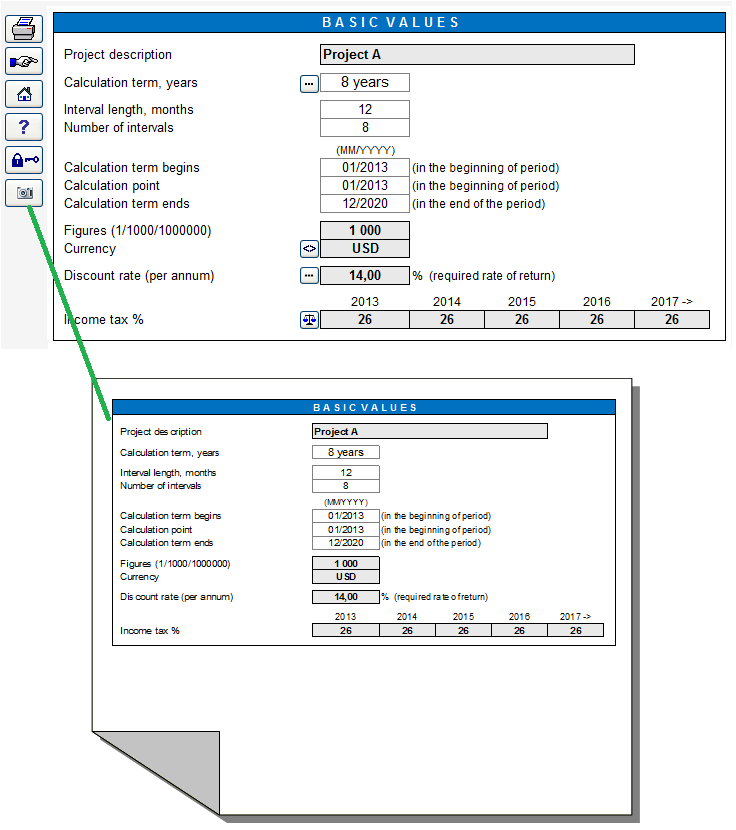
Invest for Excel files created with version 3.7 (or newer) templates have camera buttons at each table. Pressing the camera button will place a picture copy of the table or chart in the clipboard. The picture can then be pasted into another sheet, document or software.
By default, a message is displayed telling that a picture has been copied to the clipboard.
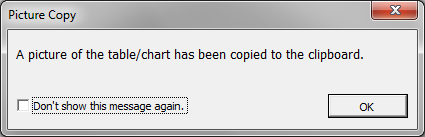
Check “Don’t show this message again” before pressing OK, if you don’t want this message to be displayed again.

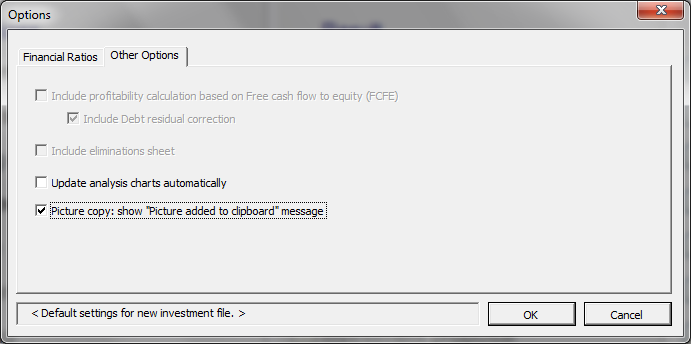
If you want to have the message displayed again, go to Invest for Excel’s Options and check “Picture copy: show “Picture added to clipboard” message”.
This function can also be applied by pressing Shift while clicking the ![]() button. This way it can be used in calculation files created before version 3.7, which don’t have camera buttons.
button. This way it can be used in calculation files created before version 3.7, which don’t have camera buttons.
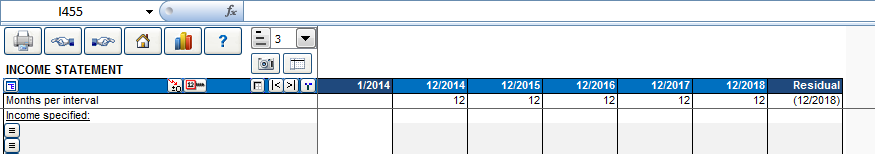
Unfreeze/freeze column headers (Calculation sheet)
You can unfreeze and freeze column headers by pressing the following button on the Calculations sheet: ![]()
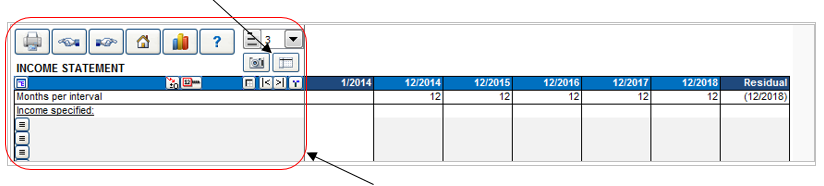
When you unfreeze column headers, only the text columns to the left are locked when you scroll right. When you scroll up or down, no rows are locked. This is useful when you create formulas that reference rows above the current table.
When you freeze column headers, both the text columns to the left and the Header rows are locked when scrolling.
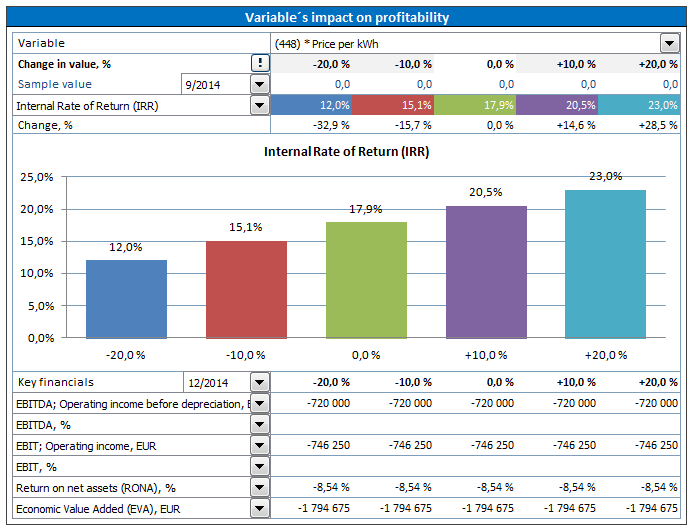
You can create up to 6 Income variable analyses. An Income variable can be selected from Investment rows, Income rows, Variable cost rows or Fixed cost rows. Example:
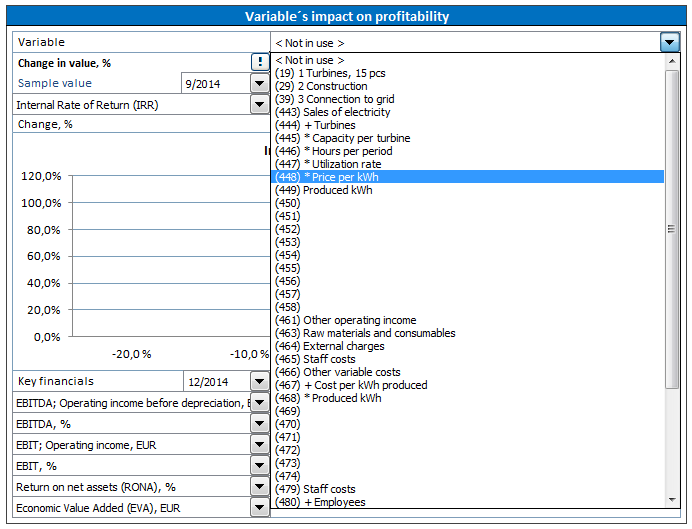
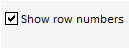
You can choose if you want to include row numbers in the dropdown lists with the check button beside the analysis:
In the Distribution dialog box you can choose to include Change indicators under the selected row.
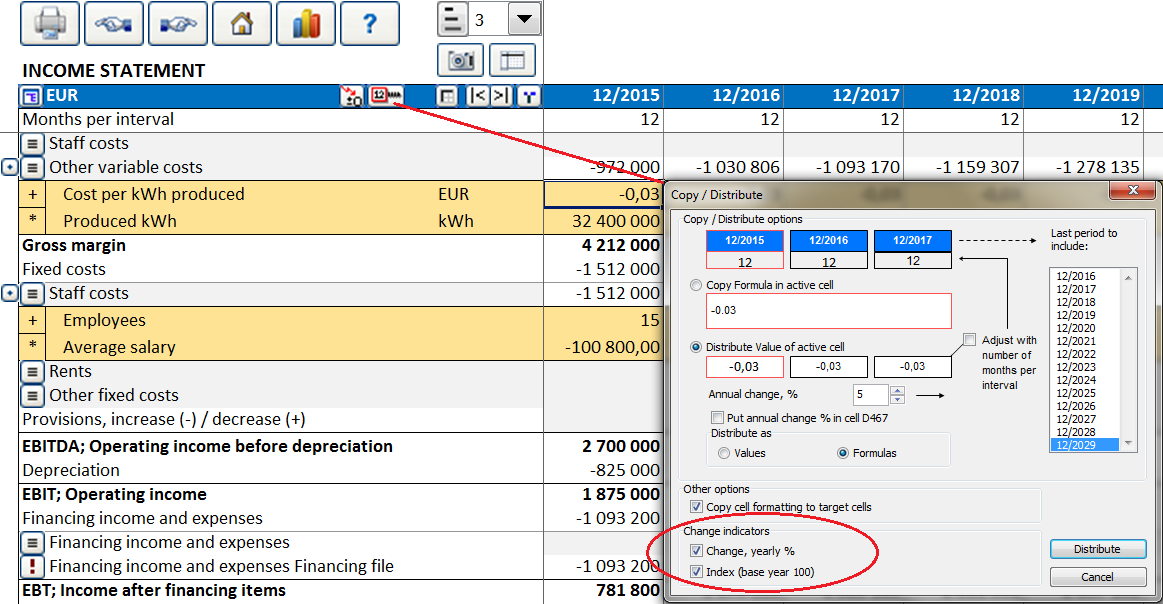
Chosen Change indicators are written to the sheet:
Change, yearly % shows the change per year of the parent row. Index (base year 100) shows the cumulative change as an index, where the starting year is 100.
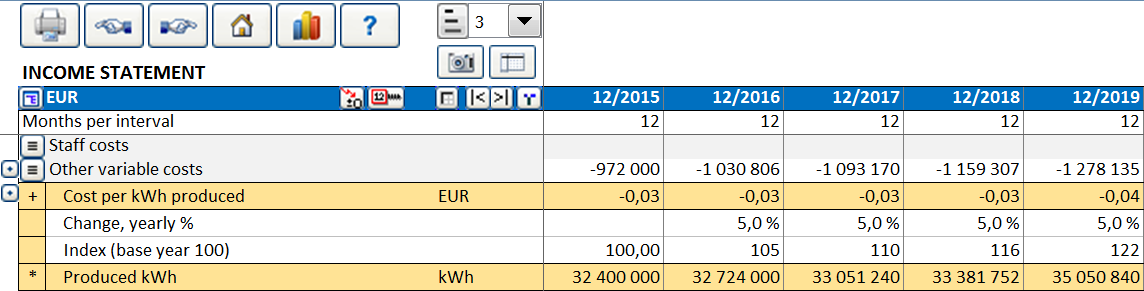
When distributing the value of a cell, you can choose to put the annual change % in a cell in column D.
The annual change of the cell can easily be altered from this cell.
This feature is not available for all rows.
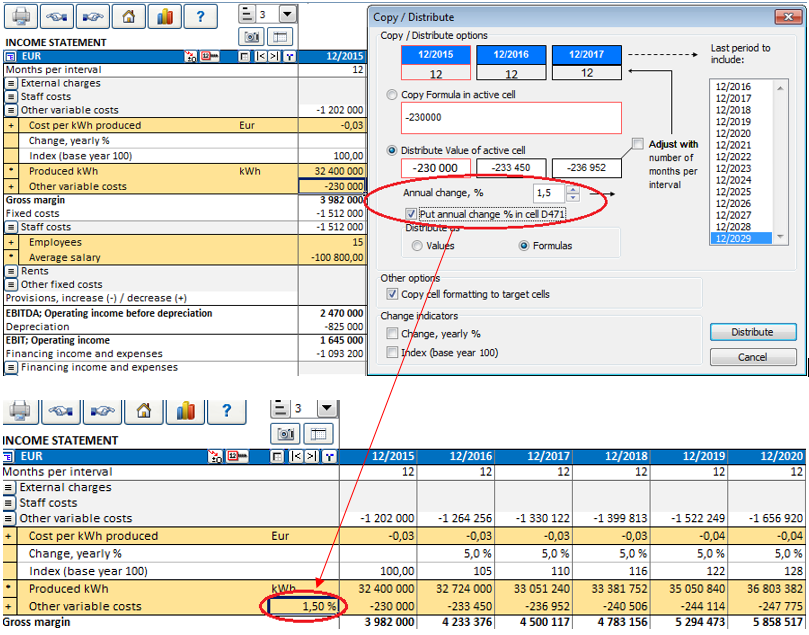
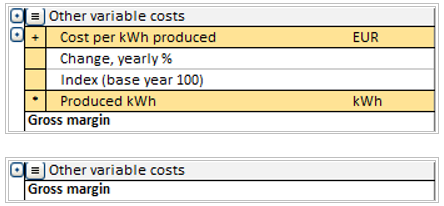
Flip buttons are automatically added for sub-rows, i.e. Specification rows and Change indicator rows. You can toggle (hide/unhide) sub-rows for the row with the Flip button by clicking it.
Flip Change indicators:
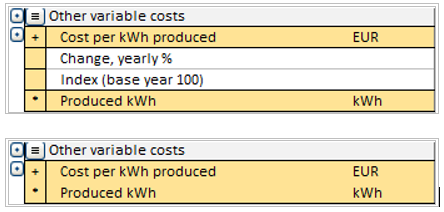
Flip Specification rows:
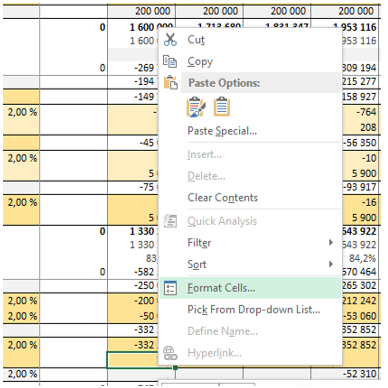
Formatting calculation file cells is allowed using Microsoft Excel’s menus and shortcuts.
Request a presentation
Contact DataPartner Oy to request a presentation and see the new Invest for Excel features in action.
E-mail: datapartner@datapartner.fi
Phone: +358 19 54 10 100